
Electric Car Prices in Ireland for 2023
Electric car prices for Ireland in 2023, compared by range and car body type and visualised using plotly. MG comes out on top!
Electric Car Prices in Ireland for 2023 Read More »
Electric car prices for Ireland in 2023, compared by range and car body type and visualised using plotly. MG comes out on top!
Electric Car Prices in Ireland for 2023 Read More »
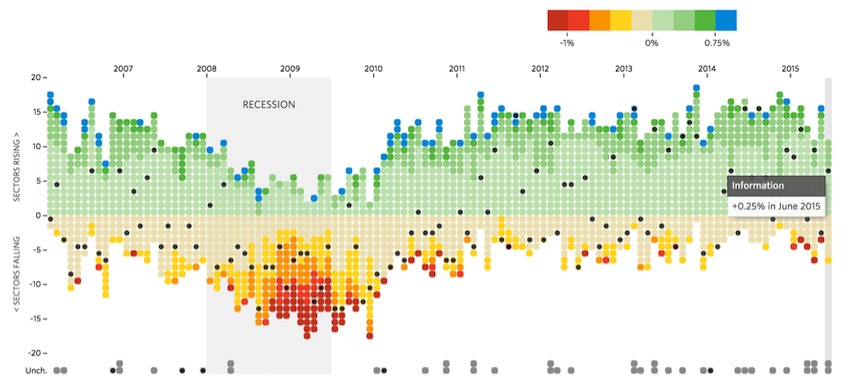
The ability to explore and grasp data structures through quick and intuitive visualisation is a key skill of any data scientist. At PyConIE 2018, I presented a talk on the various libraries available for data visualisation in Dublin. This post contains the slides from that talk, along with a video recording of same.
Data Visualisation in Python – Pycon Dublin 2018 Presentation Read More »

Anyone familiar with the use of Python for data science and analysis projects has googled some combination of “plotting in python”, “data visualisation in python”, “barcharts in python” at some point. It’s not uncommon to end up lost in a sea of competing libraries, confused and alone, and just to go home again! The purpose
Compare the Best Data Visualisation Libraries for Python and Pandas Read More »
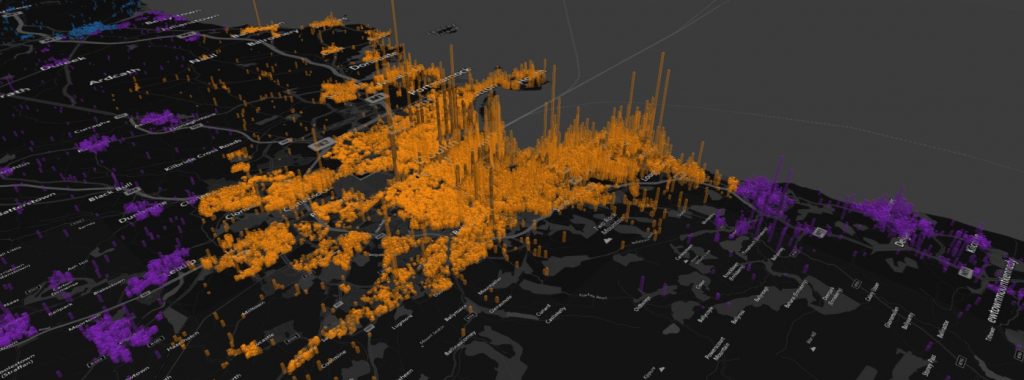
In this post, geocoded data for all property price sales in Ireland from 2012-2017 is available. Data is sourced on the Irish Property Price Register and geocoded using the Google geocoding script in Python. All of the GPS latitude/longitude coordinates are further tied to census small area and electoral division boundaries.
The Irish Property Price Register – Geocoded to Small Areas Read More »
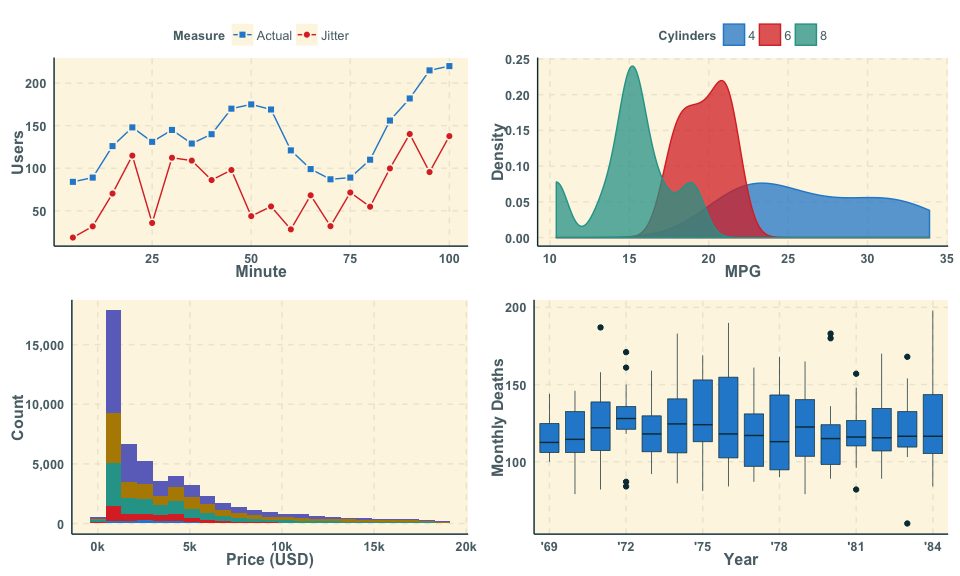
Want better colours for ggplot2? “Ggthemr” is an R package that provides new colour themes and also the specification of your own colour palettes. Change the look and feel of your ggplot2 plots in R with two quick commands! Beautiful figures await!
ggthemr – Better Themes and Colours for ggplot Figures Read More »

Do you get wet on your cycle to work? How rainy is Ireland? In this post we work out what percentage of cycles you get rained on in Ireland and around the world!
Rainy cycling commutes in Ireland? Wunderground data in Python Read More »