
At the start of every analysis, data needs to be cleaned, organised, and made tidy. For every Python Pandas DataFrame, there is almost always a need to delete rows and columns to get the right selection of data for your specific analysis or visualisation. The Pandas Drop function is key for removing rows and columns.
Pandas Drop Cheatsheet
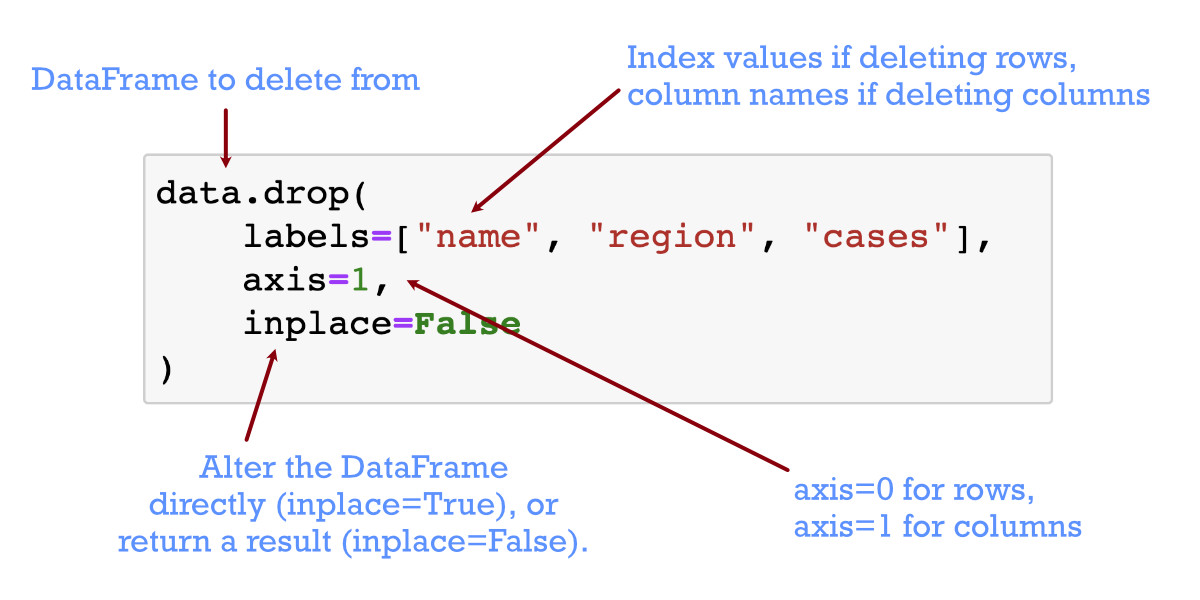
Removing columns and rows from your DataFrame is not always as intuitive as it could be. It’s all about the “DataFrame drop” command. The drop function allows the removal of rows and columns from your DataFrame, and once you’ve used it a few times, you’ll have no issues.
Sample DataFrame
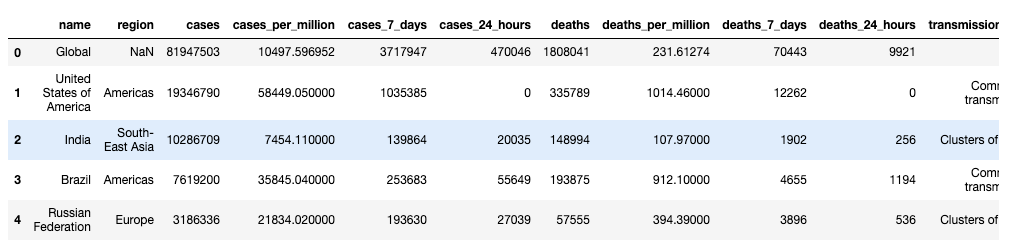
For this post, we’re using data from the WHO COVID tracker, downloaded as at the 1st January 2020 (data here). If you’d like to work with up-to-date data, please change the source URL for the read_csv function in the loading script to this one.
import pandas as pd

# Read a sample dataset (COVID data as at 1st Jan 2020)
data = pd.read_csv(
    "https://shanebucket.s3-eu-west-1.amazonaws.com/downloads/who-covid-2020-01-01.csv.zip"
)
# If you'd like to get up-to-date data, use URL: https://covid19.who.int/WHO-COVID-19-global-table-data.csv
# Rename the columns into something a little easier to work with.
data.columns = [
    "name",
    "region",
    "cases",
    "cases_per_million",
    "cases_7_days",
    "cases_24_hours",
    "deaths",
    "deaths_per_million",
    "deaths_7_days",
    "deaths_24_hours",
    "transmission_type"
]
data.head()
Delete or Drop DataFrame Columns with Pandas Drop
Delete columns by name
Deleting columns by name from DataFrames is easy to achieve using the drop command. There are two forms of the drop function syntax that you should be aware of, but they achieve the same result:
Delete column with pandas drop and axis=1
The default way to use “drop” to remove columns is to provide the column names to be deleted along with specifying the “axis” parameter to be 1.
# Delete a single column from the DataFrame
data = data.drop(labels="deathes", axis=1)

# Delete multiple columns from the DataFrame
# Here - we provide a list to the drop() function
data = data.drop(labels=["deaths", "deaths_per_million"], axis=1)

# Note that the "labels" parameter is by default the first, so
# the above lines can be written slightly more concisely:
data = data.drop("deaths", axis=1)
data = data.drop(["deaths", "deaths_per_million"], axis=1)
Delete column with pandas drop “columns” parameter
Potentially a more intuitive way to remove columns from DataFrames is to use the normal “drop” function with the “columns” parameter specifying a single column name or a list of columns.
# Delete a single named column from the DataFrame
data = data.drop(columns="cases")

# Delete multiple named columns from the DataFrame
data = data.drop(columns=["cases", "cases_per_million"])
Delete columns by column number or index
The drop function can be used to delete columns by number or position by retrieving the column name first for .drop. To get the column name, provide the column index to the Dataframe.columns object which is a list of all column names. The name is then passed to the drop function as above.
# Delete a column by column number
# Delete column number 4 (index number 3 in data.columns)
data = data.drop(columns=data.columns[3])
WARNING: This method can end up in multiple columns being deleted if the names of the columns are repeated (i.e. you have two columns with the same name as the one at index 3).
When you have repeating columns names, a safe method for column removal is to use the iloc selection methodology on the DataFrame. In this case, you are trying to “select all rows and all columns except the column number you’d like to delete”.
To remove columns using iloc, you need to create a list of the column indices that you’d like to keep, i.e. a list of all column numbers, minus the deleted ones.
To create this list, we can use a Python list comprehension that iterates through all possible column numbers (range(data.shape[1])) and then uses a filter to exclude the deleted column indexes (x not in [columns to delete]). The final deletion then uses an iloc selection to select all rows, but only the columns to keep (.iloc[:, [columns to keep]).
# Delete column numbers 1, 2 and 5 from the DataFrame
# Create a list of all column numbers to keep
columns_to_keep = [x for x in range(data.shape[1]) if x not in [1,2,5]]
# Delete columns by column number using iloc selection
data = data.iloc[:, columns_to_keep]
data.shape
--> (238, 8)
Delete DataFrame Rows with Pandas Drop
There are three different ways to delete rows from a Pandas Dataframe. Each method is useful depending on the number of rows you are deleting, and how you are identifying the rows that need to be removed.
Deleting rows using “drop” (best for small numbers of rows)
Delete rows based on index value
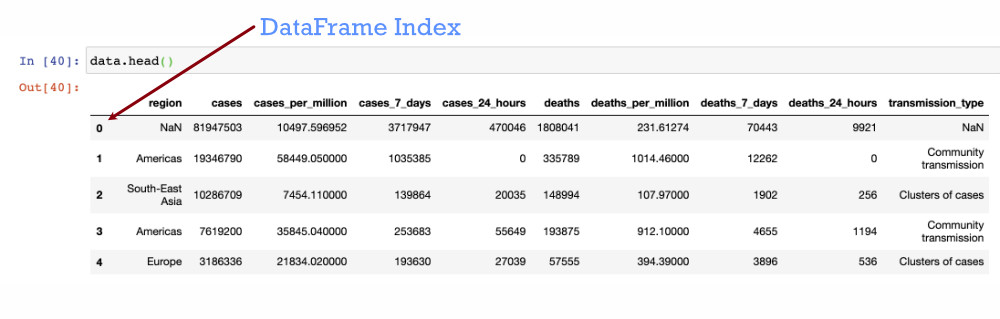
To delete rows from a DataFrame, the drop function references the rows based on their “index values“. Most typically, this is an integer value per row, that increments from zero when you first load data into Pandas. You can see the index when you run “data.head()” on the left hand side of the tabular view. You can access the index object directly using “data.index” and the values through “data.index.values”.
To drop a specific row from the data frame – specify its index value to the Pandas drop function.
# delete a single row by index value 0
data = data.drop(labels=0, axis=0)

# delete a few specified rows at index values 0, 15, 20.
# Note that the index values do not always align to row numbers.
data = data.drop(labels=[1,15,20], axis=0)

# delete a range of rows - index values 10-20
data = data.drop(labels=range(40, 45), axis=0)

# The labels parameter name can be omitted, and axis is 0 by default
# Shorter versions of the above:
data = data.drop(0)
data = data.drop([0, 15, 20])
data = data.drop(range(10,20))
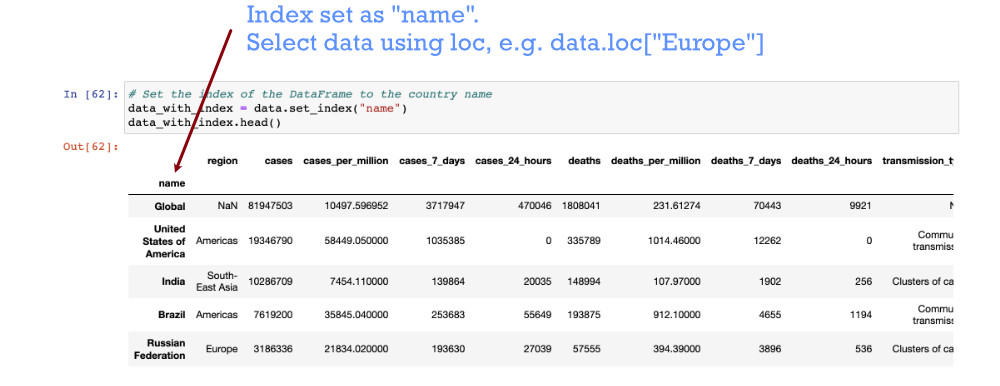
It can be useful for selection and aggregation to have a more meaningful index. For our sample data, the “name” column would make a good index also, and make it easier to select country rows for deletion from the data.
# Set the index of the DataFrame to the country name
data_with_index = data.set_index("name")
data_with_index.head()
# With the index, we can drop the rows for a single country with its name
data_with_index = data_with_index.drop("Ireland")

# Drop rows for multiple countries:
data_with_index = data_with_index.drop(["France", "Canada", "Spain"])
Delete rows based on row number
At times, the DataFrame index may not be in ascending order. To delete a row based on it’s position in the DataFrame, i.e. “delete the second row”, we still use the index of the DataFrame, but select the row from the index directly as we delete. We can also use these index selections to delete multiple rows, or index from the bottom of the DataFrame using negative numbers. For example:
# Delete the 2nd row in the DataFrame (note indices starting from 0)
data = data.drop(data.index[1])

# Delete some chosen rows by row numbers - 2nd, 10th, 30th:
data = data.drop(data.index[[1, 9, 29]])

# Delete the first 5 rows
data = data.drop(data.index[range(5)])

# Delete the last row in the DataFrame
data = data.drop(data.index[-1])
Deleting rows based on a column value using a selection (iloc/loc)
The second most common requirement for deleting rows from a DataFrame is to delete rows in groups, defined by values on various columns. The best way to achieve this is through actually “selecting” the data that you would like to keep. The “drop” method is not as useful here, and instead, we are selecting data using the “loc” indexer and specifying the desired values in the column(s) we are using to select.
There is a full blog post on Pandas DataFrame iloc and loc selection on this blog, but a basic example is here:
# Check the initial shape of the DataFrame
data.shape
--> (238, 11)
# Delete rows where case numbers are zero
# This deletion is completed by "selecting" rows where case numbers are non zero
data = data.loc[data["cases"] != 0]
data.shape
--> (223, 11)
# Delete rows where there have been no cases in 24 hours AND no cases in 7 days
# Note that you must put each condition within parenthesis
data = data.loc[(data["deaths_7_days"] > 0) & (data["deaths_24_hours"] > 0)]
data.shape
--> (114, 11)
Note – if you get the Pandas error: ValueError: The truth value of a Series is ambiguous. Use a.empty, a.bool(), a.item(), a.any() or a.all(), then you have most likely left out the parenthesis “( )” around each condition of your loc selection.
Deleting rows by truncating the DataFrame
One final way to remove rows from the DataFrame is to use Python “slice” notation. Slice notation is well summarised in this StackOverflow post:
data[start:stop]  # items start through stop-1
data[start:]      # items start through the rest of the DataFrame
data[:stop]       # items from the beginning through stop-1
data[:]           # a copy of the whole DataFrame
The slice notation makes it easy to delete many rows from a DataFrame, while retaining the selected “slice”. For example:
# Start with a new dataset again
data.shape
--> (238, 11)
data = data[:100]   # Delete everything but the first 99 rows.
data.shape
--> (100, 11)
data = data[10:20]
data.shape
--> (10, 11)
Dropping “inplace” or returning a new DataFrame
The drop function can be used to directly alter a Pandas DataFrame that you are working with, or, alternatively, the return the result after columns or rows have been dropped. This behaviour is controlled with the “inplace” parameter. Using inplace=True can reduce the number of reassignment commands that you’ll need in your application or script. Note that if inplace is set as True, there is no return value from the drop function.
# Start by looking at our original data.
# DataFrame "shape" gives us a tuple with (number rows, number columns)

data.shape
--> (238, 11)

# We can delete a column using the drop command, with axis=1.
new_data = data.drop("name", axis=1)

# The new_data that is produced as only 10 columns ("name" is removed)
new_data.shape
--> (238, 10)

# The original data is left untouched at this point:
data.shape
--> (238, 11)

# Using "inplace", we can alter the original data in a single line:
data.drop("name", axis=1, inplace=True)
# Now "name" has been removed from the original data:
data.shape
--> (238, 10)
Further Reading and Links
As deleting columns and rows is one of the key operations for DataFrames, there’s a tonne of of excellent content out there on the drop function, that should explain any unusual requirement you may have. I’d be interested in any element of removing rows or columns not covered in the above tutorial – please let me know in the comments.
- My own blog post on selection through iloc and loc, which can be used for picking out the data that you need from a DataFrame.
- Official Pandas Documentation on the DataFrame Drop function.
- GeeksForGeeks tutorial on removing columns from DataFrames.
- HackersAndSlackers – Dropping Rows of Data using Pandas.
This was so helpful , thank you so much <3 ^_^
So very helpful. Thank you for this.
Very clearly mentioned and very precise. Thanks so much for this
Extremely helpful
I attempted to use “Deleting rows based on a column value using a selection (iloc/loc)” method for a query and I am still getting the “The truth value of a Series is ambiguous. Use a.empty, a.bool(), a.item(), a.any() or a.all().” error. My code is below. I am basically trying to remove any rows that have “2022RMBsSquares” during the months of March-May of 2022. Thank you
df2 = df.loc[(df[“creative_campaign”] != “2022RMBSquares”) & (df[“MONTH”] != ‘3/1/2022’, ‘4/1/2022’, ‘5/1/2022’)]
I am splitting my query into two parts; one is a full CSV file, while the other is aggregated and condensed (hence the df and df2)
thank you guys, how to delete row that fill values ? e.g = 100
Very good, thank you!
Minor comment – the comments in the first example under “Delete rows based on index value” do not line up exactly with the code.
Very helpful! Thank you!
Thanks dear Lynn
Thank you, very helpful.
I was struggling trying to concatenate 2 dataframes, with axis=1, and it turned out that one of the 2 dataframes had all indices = 0.
After a lot of frustration, I realized that all those indices were = 0. But when I tried to drop the first row, I ended up dropping every row.
Might be something worth mentioning in your post – you mentioned that you can drop by location rather than index, but I think maybe explicitly saying that it’s possible for a dataframe to have duplicate indices, might be helpful to the newbies like myself 🙂
hey hi,
I am daksha, i have to remove ‘lacs’ from ‘2.3 lacs’ and retain the value ‘2.3’, how do i do that?