vizualisation

Use the fitbit api v1.2 to access your health sleep heart data

Plot your Fitbit data in Python (API v1.2)

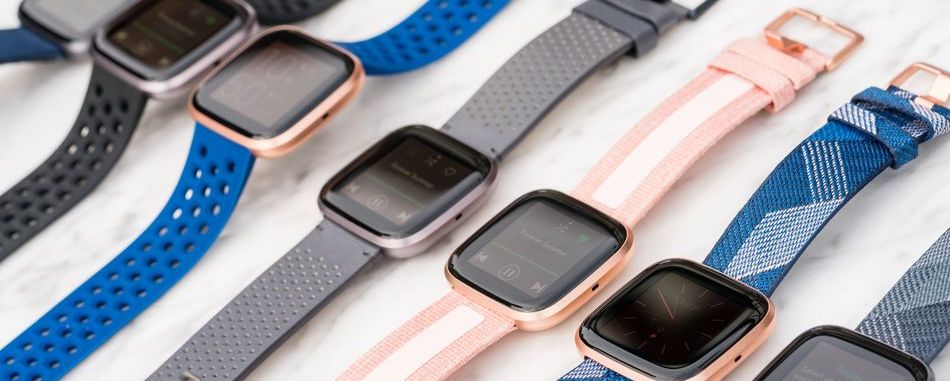
Introduction Sleeping, and python. Two of my favourite things, when combined with the the Python Fitbit library, Matplotlib, and Pandas, can generate informative plots of your sleeping habits! This post explores how we can pull date from the Fitbit API, create a Pandas Dataframe, and then plot the results. In this tutorial, I’ve used Python …
Plot your Fitbit data in Python (API v1.2) Read More »

data graphs alternatives

Compare the Best Data Visualisation Libraries for Python and Pandas

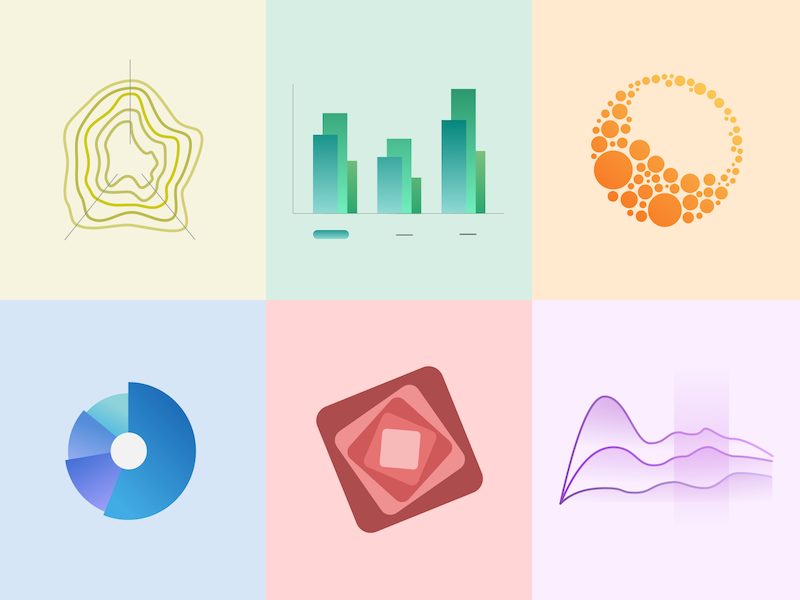
Anyone familiar with the use of Python for data science and analysis projects has googled some combination of “plotting in python”, “data visualisation in python”, “barcharts in python” at some point. It’s not uncommon to end up lost in a sea of competing libraries, confused and alone, and just to go home again! The purpose …

Compare the Best Data Visualisation Libraries for Python and Pandas Read More »