Introduction
Sleeping, and python. Two of my favourite things, when combined with the the Python Fitbit library, Matplotlib, and Pandas, can generate informative plots of your sleeping habits! This post explores how we can pull date from the Fitbit API, create a Pandas Dataframe, and then plot the results.
In this tutorial, I’ve used Python 3.7 to access data, the Fitbit Python library (with some adjustments for v1.2 of the Fitbit API), Pandas to manage the data, and Matplotlib to generate some visualisations.
Fitbit Direct Export Functionality
Note that you can also request data as a single dump directly from the Fitbit website. Log in, navigate to settings, data export, and “request export”. (see instruction here) Note it may take some hours to export your data if there is a lot there, I may add some scripts to parse data in this format if I can.

The Fitbit API and OAuth access
The Fitbit API is a well-documented RESTful API where all of your movement, sleep, heart rate, and food logging data (if tracked by a Fitbit device) can be programmatically accessed. To access data, you’ll need to create an “application” with a registered Fitbit developer user account. The applications will be granted access to your personal Fitbit data through the API. Application authorisation follows what’s called the “OAuth2.0” specification.
There are different API endpoints for each type of data, and all of the responses come back in JSON formats that can be easily converted back to Python dictionaries and Pandas Dataframes for processing.
Example JSON response:
{
  "logId" : 27198605014,
  "dateOfSleep" : "2020-05-16",
  "startTime" : "2020-05-16T03:01:00.000",
  "endTime" : "2020-05-16T11:10:30.000",
  "duration" : 29340000,
  "minutesToFallAsleep" : 0,
  "minutesAsleep" : 437,
  "minutesAwake" : 52,
  "minutesAfterWakeup" : 0,
  "timeInBed" : 489,
  "efficiency" : 97,
  "type" : "stages",
  "infoCode" : 0,
  "levels" : {
    "summary" : {
      "deep" : {
        "count" : 4,
        "minutes" : 73,
        "thirtyDayAvgMinutes" : 77
      },
      "wake" : {
        "count" : 40,
        "minutes" : 52,
        "thirtyDayAvgMinutes" : 57
      },
      "light" : {
        "count" : 41,
        "minutes" : 264,
        "thirtyDayAvgMinutes" : 254
      },
      "rem" : {
        "count" : 10,
        "minutes" : 100,
        "thirtyDayAvgMinutes" : 103
      }
    }
}
Oauth2 primer
To make our lives easy, we’ll use the existing and excellent Fitbit Python library to handle some of the over and back for application authentication, but it’s worth understanding the basics. OAuth2 is a method of granting applications or users access to certain data or resources, and essentially the flow is:
- Your application points the end user (through a browser) to the Fitbit authorisation page using an application client ID and secret key.
- The user logs in and “grants access” to different “scopes” (descriptions of data access levels).
- An “authorisation code” is generated which is given back to your application by redirecting the browser to a “callback url” (for now, this will be hosted on your computer).
- The application creates an “access token” and “refresh token” based on the authorisation code.
- The “access token” is used in further API requests to get data.
- Over time, the access token will expire (8 hours), and the refresh token can be used to create a new access and refresh token.
See here for Fitbit specific implementations of OAuth2.
Create a personal Fitbit App
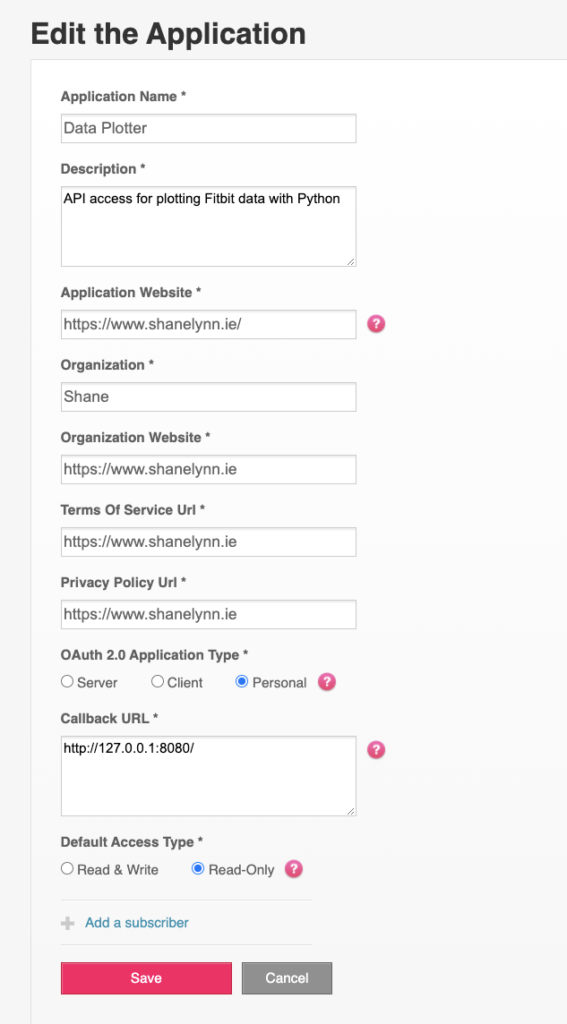
Start off by creating a new application on dev.fitbit.com.
Set up an account at dev.fitbit.com and create a new “application”. You’ll be creating just a “personal” application for use only with your own account, so the details for website, terms of service, and privacy policy don’t particularly matter.
The key element to get right here is to set the “Callback URL” to “http://127.0.0.1:8080/”. This URL will be used as part of the OAuth2 authorisation described above in step 3. My application setup looks like this:
When the application is created, you’ll be able to download the Application “client ID” and “client secret”. These are the core credentials for your application, and are used during the OAuth2 process – store these somewhere for the next step.
Authenticate and get an API token
There’s a useful file in the Fitbit Python library called “gather_keys_oauth2.py” (original available here). This file implements a small local web server that you can use to authenticate with the Fitbit API to request an access and refresh token.
There’s a few simple steps to run this application locally on your machine:
- Copy the contents of gather_keys_oauth2.py to a local file with the same name.
- Install the cherrypy (
pip install cherrypy) and Fitbit (pip install fitbit) libraries into your Python environment. (Ideally, set up a local virtual environment for your project) Cherrypy is a lightweight web server software that helps with the redirect URL from Fitbit during the OAuth2 flow. - Activate your virtual environment, change to the directory where you have created your
gather_keys_oauth2.pyfile and run the file, specifying your application client ID and secret key in the command, e.g:python gather_keys_oauth2.py CLIENT_ID CLIENT_SECRET
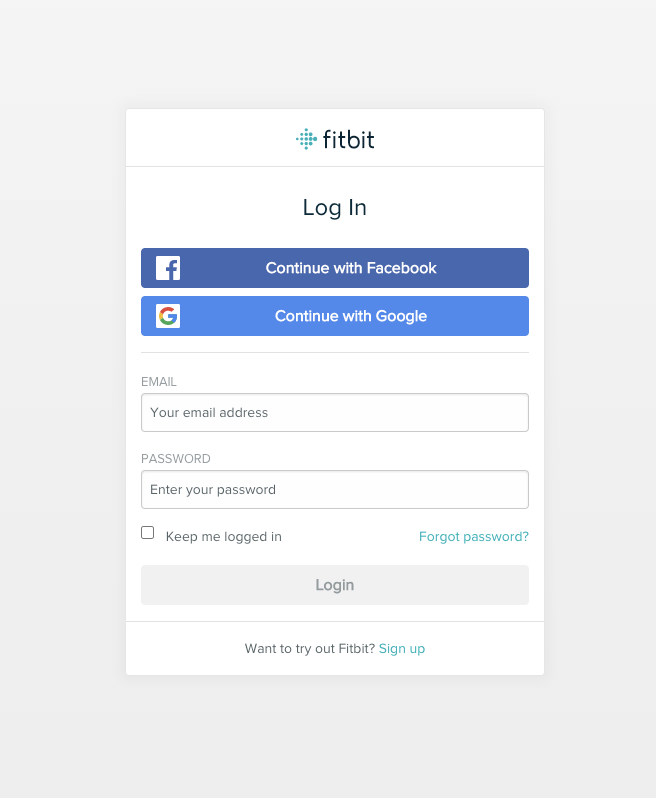
for me, this was similar to (not real codes here):python gather_keys_oauth2.py 22ARNQ f3ad3eedfabccbd33a3149f3b - The script will open a browser window that presents a login page to Fitbit, where you can give permission to your application to access your data.
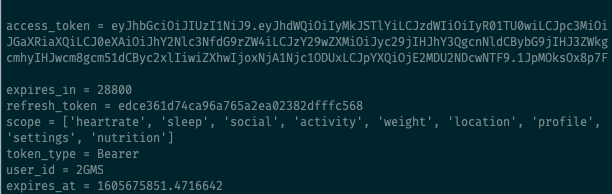
- When successfully authenticated, the
gather_keys_oauth2.pyscript will print the access token and refresh token to the console window.
Download your sleep data
The Fitbit python library, by default, is set up to use version 1 of the Fitbit API, whereas there is better quality data available from the V1.2 API. We’re going to use the Fitbit library to manage the data requests, but we’re going to manually specify the V1.2 API URLs so that we get the best data.
For this particular post, we’re interested in sleep data, and the resource URLs that are useful are:
- Per day data available at:
https://api.fitbit.com/1.2/user/[user-id]/sleep/date/[date].json - Date range data availabile at (max 100 days):
https://api.fitbit.com/1.2/user/[user-id]/sleep/date/[startDate]/[endDate].json
The response from the API, when you are authenticated, includes summaries of your sleep for each date:
- A breakdown of your night, in two formats:
- “Stages”: This is more detailed analysis of your sleep on the latest devices. The data includes total event count and total minutes of deep, light, REM, and wakefulness for the night
- “Classic”: A more basic breakdown of your sleep into just asleep, awake, and restless moments.
- Summary stats on total minutes awake, total minutes asleep, time in bed, minutes to fall asleep (I found this last one slightly unreliable).
The data is split in two sections in the JSON response, “data” which includes any sleep stages or wake periods longer than three minutes, and a “shortData” which includes short wake periods less than 3 minutes in duration.
Here, I want to download more than 100 days of data, and so we need to generate all of the 100 day periods between our ultimate date targets. I’ve used the Arrow date/time management library to make this easier.
import fitbit
import pandas as pd
import matplotlib.pyplot as plt
import matplotlib.dates as mdates
import arrow. # Arrow is a really useful date time helper library
client = fitbit.Fitbit(
'<paste application client ID>',
'<paste application secret key>',
access_token='<paste access_token here>',
refresh_token='<paste refresh token here>'
)
start_date = arrow.get("2018-09-01")
end_date = arrow.get("2020-11-01")
# Create a series of 100-day date-range tuples between start_date and end_date
date_ranges = []
start_range = start_date
while start_range < end_date:
if start_range.shift(days=100) < end_date:
date_ranges.append((start_range, start_range.shift(days=100)))
start_range = start_range.shift(days=101)
else:
date_ranges.append((start_range, end_date))
start_range = end_date
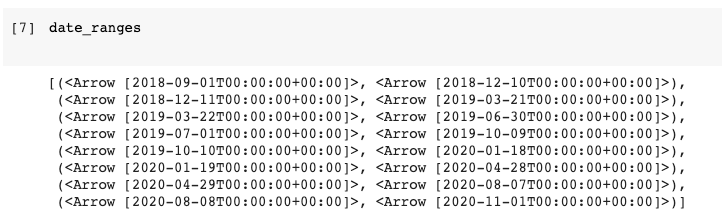
# Print the result to the console
date_ranges
Now we simply iterate through the different date ranges and request the data for each one from Fitbit:
all_data = []
for date_range in date_ranges:
  print(f"Requesting data for {date_range[0]} to {date_range[1]}.")
  url = f"{client.API_ENDPOINT}/1.2/user/-/sleep/date/{date_range[0].year}-{date_range[0].month:02}-{date_range[0].day:02}/{date_range[1].year}-{date_range[1].month:02}-{date_range[1].day:02}.json"
  range_data = client.make_request(url)
  all_data.append(range_data)
  print(f"Success!")
Convert data to a Pandas DataFrame
The final step is to combine all of the data together into a manageable and easily visualisable Pandas DataFrame.
sleep_summaries = []
# Iterate through all data and create a list of dictionaries of results:
for data in all_data:
for sleep in data["sleep"]:
# For simplicity, ignoring "naps" and going for only "stage" data
if sleep["isMainSleep"] and sleep["type"] == "stages":
sleep_summaries.append(dict(
date=pd.to_datetime(sleep["dateOfSleep"]).date(),
duration_hours=sleep["duration"]/1000/60/60,
total_sleep_minutes=sleep["minutesAsleep"],
total_time_in_bed=sleep["timeInBed"],
start_time=sleep["startTime"],
deep_minutes=sleep["levels"]["summary"].get("deep").get("minutes"),
light_minutes=sleep["levels"]["summary"].get("light").get("minutes"),
rem_minutes=sleep["levels"]["summary"].get("rem").get("minutes"),
wake_minutes=sleep["levels"]["summary"].get("wake").get("minutes"),
))
# Convert new dictionary format to DataFrame
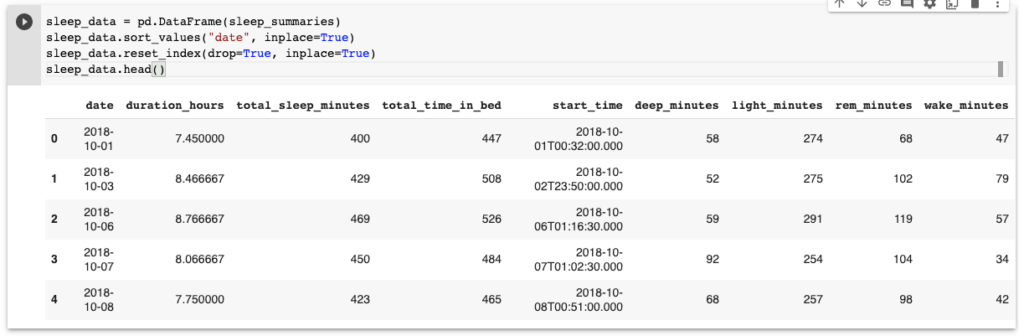
sleep_data = pd.DataFrame(sleep_summaries)
# Sort by date and view first rows
sleep_data.sort_values("date", inplace=True)
sleep_data.reset_index(drop=True, inplace=True)
sleep_data.head()
We can add some useful columns to help with visualisation now:
# It's useful for grouping to get the "date" from every timestamp
sleep_data["date"] = pd.to_datetime(sleep_data["date"])
# Also add a boolean column for weekend detection
sleep_data["is_weekend"] = sleep_data["date"].dt.weekday > 4
Visualise with Pandas and Matplotlib!
Finally for the fun bit! For this post, I’ve used the built-in integration between Matplotlib and Pandas to generate some summary graphics of my sleep data:
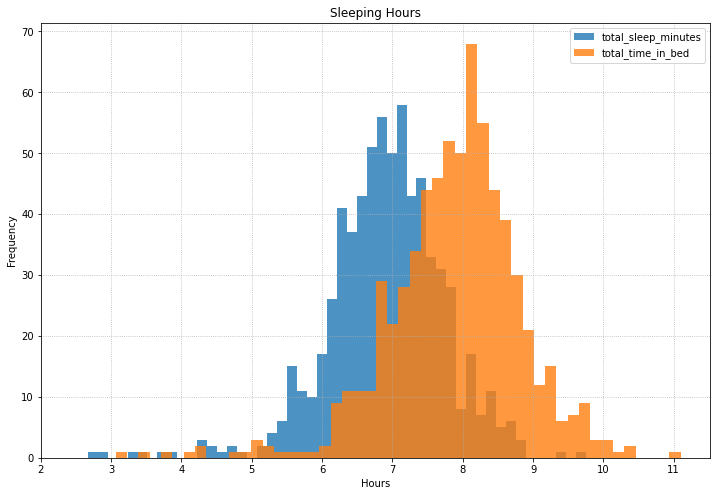
Sleep distributions
A two-layer histogram of time asleep vs total time in bed is a nice visualisation of “bed efficiency” that you are achieving!
# Sleep distribution
(sleep_data["total_sleep_minutes"]/60).plot(
    kind="hist",
    bins=50,
    alpha=0.8,
    figsize=(12,8)
)
(sleep_data["total_time_in_bed"]/60).plot(
    kind="hist",
    bins=50,
    alpha=0.8
)
plt.legend()

# add some nice axis labels:
ax = plt.gca()
ax.set_xticks(range(2,12))
plt.grid("minor", linestyle=":")
plt.xlabel("Hours")
plt.ylabel("Frequency")
plt.title("Sleeping Hours")
Sleep efficiency
Along with the histogram, a scatter plot is an effective method to compare total bed duration vs total sleep duration, and adding a perfect linear fit line shows how far off “100% efficiency” my sleep is. I didn’t fit a line to the data, but the graph suggests an approximate 50 minute X-intercept lost each night to “awake in bed” moments (!), in agreement with our histogram above.
# Plot a scatter plot directly from Pandas
sleep_data.plot(
    x="total_time_in_bed",
    y="total_sleep_minutes",
    kind="scatter",
    figsize=(10,10)
)
# Add a perfect 1:1 line for comparison
ax = plt.gca()
ax.set_aspect("equal")
x = np.linspace(*ax.get_xlim())
ax.plot(x,x, linestyle="--")
plt.grid(linestyle=":")

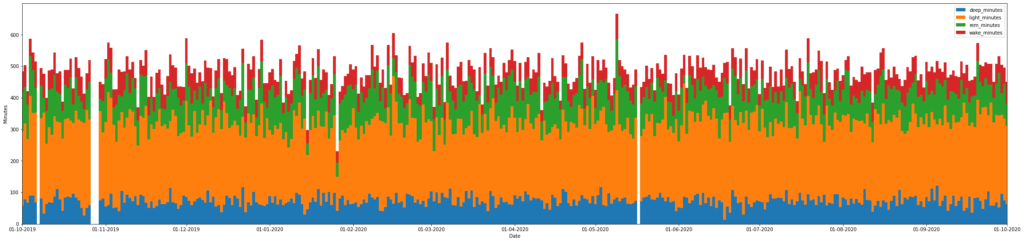
Sleep patterns over time
Show a longer term pattern of sleep over a year or two duration to see general trends. I was surprised to see how consistent sleep has been over the years, with the odd extra long or extra short sleep that, upon investigation, I could attribute to particularly early flights or restful holidays!
# Sleep makeup - calculate data to plot
plot_data = sleep_data.\
  sort_values("date").\
  set_index("date")\
  [["deep_minutes", "light_minutes", "rem_minutes", "wake_minutes"]]

# Matplotlib doesn't natively support stacked bars, so some messing here:
df = plot_data
fig, ax = plt.subplots(figsize=(30,7), constrained_layout=True)

bottom = 0
for c in df.columns:
  ax.bar(df.index, df[c], bottom=bottom, width=1, label=c)
  bottom+=df[c]

# Set a date axis for the x-axis allows nicer tickmarks.
ax.xaxis.set_major_locator(mdates.MonthLocator())
ax.xaxis.set_major_formatter(mdates.DateFormatter('%d-%m-%Y'))
ax.legend()

plt.xlabel("Date")
plt.ylabel("Minutes")
# Show a subset of data for clarity on the website:
plt.xlim(pd.to_datetime("2018-10-01"), pd.to_datetime("2020-10-01"))
Go Further
You can use the above method to also retrieve and analysis food, activity, and heartrate data, all of which would make fantastic subject matter for further plots and exploration.
If you get stuck, there’s further blog posts and resources on the subject that are worth referencing:
- Towards Data Science: Using the Fitbit Web API with Python
- Towards Data Science: Collect your own fitbit data with python
- The Fitbit API documentation
- Analytics Vidhya: Exploring your Fitbit sleep data with Python, Pandas, and Seaborn
Hello,
I tried to follow this tutorial but I keep getting an error keyError: date when I Sort by date and view first rows
sleep_data.sort_values(“date”, inplace=True)
Please could you help me by telling me how to get the sleep data with .sort_values(“date”)? I have been at it for weeks and still cant figure it out.
There’s some error in your code.
In the first section
import arrow. #Arrow is a really useful date time helper library.
should not have a . after arrow.
Print the result to the console
date_ranges
#should be
print(date_ranges)
in the sleep distributions you forgot the code to display the plot.
you need to add
plt.show()
Also the sleep efficiency section you forgot to import numpy so you need to add code.
import numpy as np
to the top of your code.
Other than that cool tutorial. I will find it helpful in my project.