R

The Irish Property Price Register – Geocoded to Small Areas

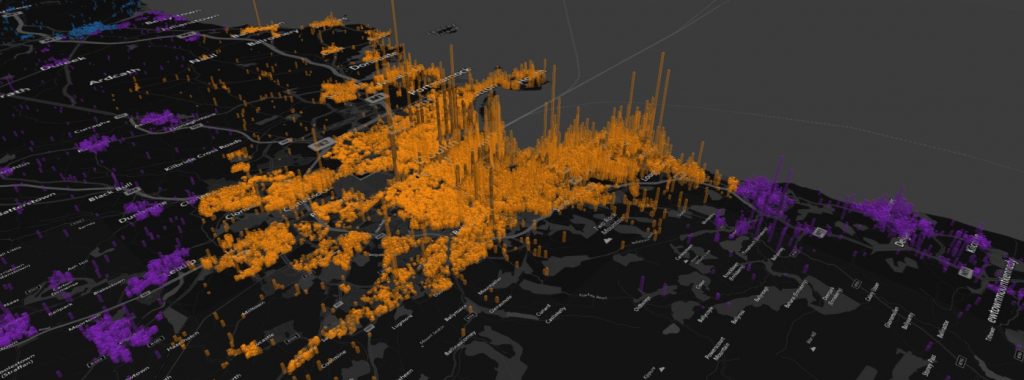
In this post, geocoded data for all property price sales in Ireland from 2012-2017 is available. Data is sourced on the Irish Property Price Register and geocoded using the Google geocoding script in Python. All of the GPS latitude/longitude coordinates are further tied to census small area and electoral division boundaries.

The Irish Property Price Register – Geocoded to Small Areas Read More »
Use Pandas Groupby to Group and Summarise DataFrames

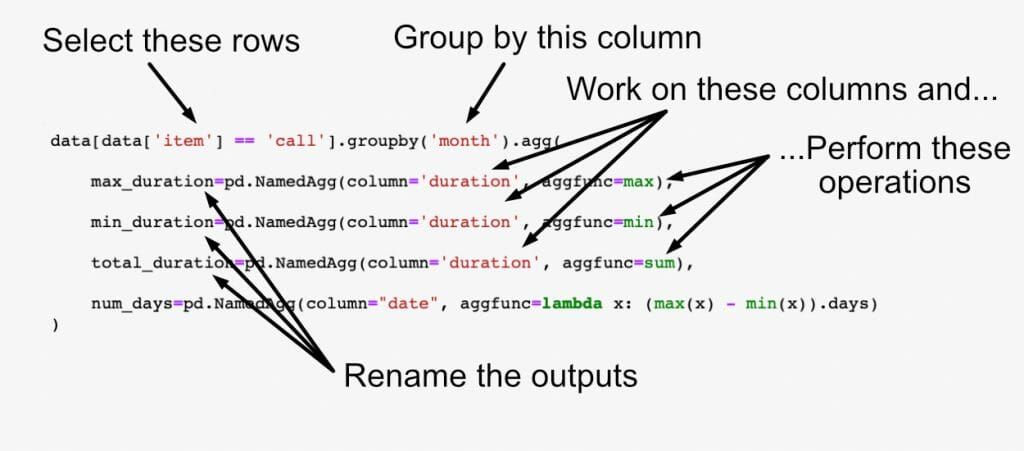
Aggregation and data grouping of Dataframes is accomplished in Python Pandas using “groupby()” and “agg()” functions. In this post, we’ll look at every aspect of grouping by single or multiple columns, applying aggregation functions such as max, min, count, and naming the resulting Dataframes and Pandas Series.

Use Pandas Groupby to Group and Summarise DataFrames Read More »

Multiple heatmaps

Self-Organising Maps for Customer Segmentation using R

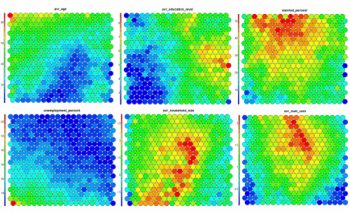
Self-Organising Maps Self-Organising Maps (SOMs) are an unsupervised data visualisation technique that can be used to visualise high-dimensional data sets in lower (typically 2) dimensional representations. In this post, we examine the use of R to create a SOM for customer segmentation. The figures shown here used use the 2011 Irish Census information for the

Self-Organising Maps for Customer Segmentation using R Read More »

Data Science Videos from Dublin WebSummit 2013

The Web Summit, Europes largest technology-industry conference was held in Dublin this week. An annual event since 2010, the Web Summit attracted over ten thousand visitors from over 90 countries. The Web Summit puts Ireland on the international startup and internet scene. With speakers like Elon Musk (founder of Paypal, SpaceX, and Tesla) and representatives from

Data Science Videos from Dublin WebSummit 2013 Read More »