
In any real world data science situation with Python, you’ll be about 10 minutes in when you’ll need to merge or join Pandas Dataframes together to form your analysis dataset. Merging and joining dataframes is a core process that any aspiring data analyst will need to master. This blog post addresses the process of merging datasets, that is, joining two datasets together based on common columns between them. Key topics covered here:
- What is a merge or join of two dataframes?
- What are inner, outer, left and right merges?
- How do I merge two dataframes with different common column names? (left_on and right_on syntax)
If you’d like to work through the tutorial yourself, I’m using a Jupyter notebook setup with Python from Anaconda, and I’ve posted the code on GitHub here. I’ve included the sample datasets in the GitHub repository.
Example data
For this post, I have taken some real data from the KillBiller application and some downloaded data, contained in three CSV files:
- user_usage.csv – A first dataset containing users monthly mobile usage statistics
- user_device.csv – A second dataset containing details of an individual “use” of the system, with dates and device information.
- android_devices.csv – A third dataset with device and manufacturer data, which lists all Android devices and their model code, obtained from Google here.
We can load these CSV files as Pandas DataFrames into pandas using the Pandas read_csv command, and examine the contents using the DataFrame head() command.
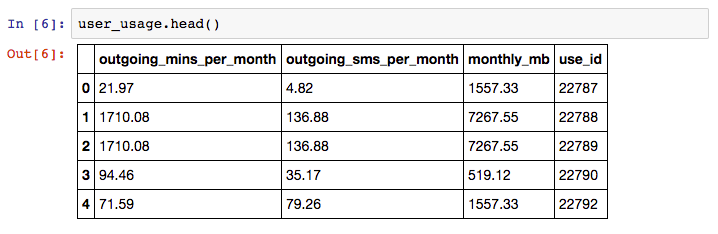
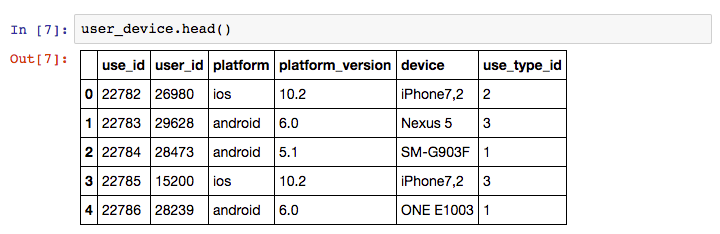
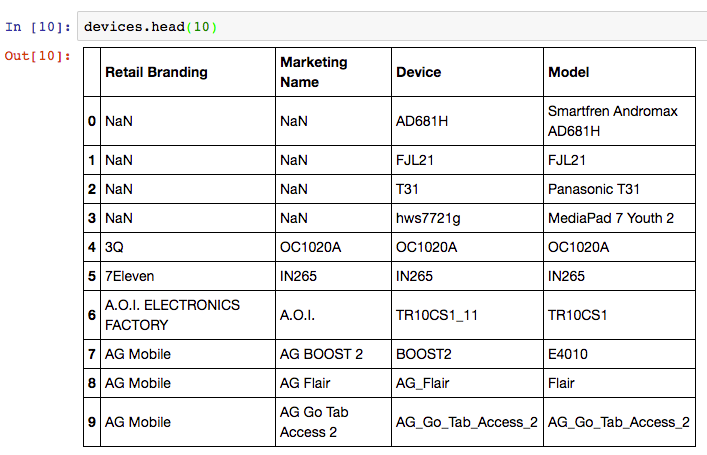
There are linking attributes between the sample datasets that are important to note – “use_id” is shared between the user_usage and user_device, and the “device” column of user_device and “Model” column of the devices dataset contain common codes.
Sample problem
We would like to determine if the usage patterns for users differ between different devices. For example, do users using Samsung devices use more call minutes than those using LG devices? This is a toy problem given the small sample size in these dataset, but is a perfect example of where merges are required.
We want to form a single dataframe with columns for user usage figures (calls per month, sms per month etc) and also columns with device information (model, manufacturer, etc). We will need to “merge” (or “join”) our sample datasets together into one single dataset for analysis.
Merging DataFrames
“Merging” two datasets is the process of bringing two datasets together into one, and aligning the rows from each based on common attributes or columns.
The words “merge” and “join” are used relatively interchangeably in Pandas and other languages, namely SQL and R. In Pandas, there are separate “merge” and “join” functions, both of which do similar things.
In this example scenario, we will need to perform two steps:
- For each row in the user_usage dataset – make a new column that contains the “device” code from the user_devices dataframe. i.e. for the first row, the use_id is 22787, so we go to the user_devices dataset, find the use_id 22787, and copy the value from the “device” column across.
- After this is complete, we take the new device columns, and we find the corresponding “Retail Branding” and “Model” from the devices dataset.
- Finally, we can look at different statistics for usage splitting and grouping data by the device manufacturers used.
Can I use a for loop?
Yes. You could write for loops for this task. The first would loop through the use_id in the user_usage dataset, and then find the right element in user_devices. The second for loop will repeat this process for the devices.
However, using for loops will be much slower and more verbose than using Pandas merge functionality. So, if you come across this situation – don’t use for loops.
Merging user_usage with user_devices
Lets see how we can correctly add the “device” and “platform” columns to the user_usage dataframe using the Pandas Merge command.
result = pd.merge(user_usage,
                 user_device[['use_id', 'platform', 'device']],
                 on='use_id')
result.head()

So that works, and very easily! Now – how did that work? What was the pd.merge command doing?
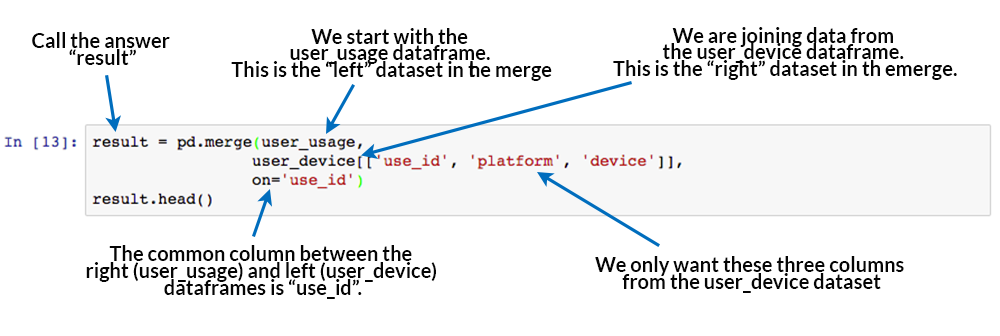
The merge command is the key learning objective of this post. The merging operation at its simplest takes a left dataframe (the first argument), a right dataframe (the second argument), and then a merge column name, or a column to merge “on”. In the output/result, rows from the left and right dataframes are matched up where there are common values of the merge column specified by “on”.
With this result, we can now move on to get the manufacturer and model number from the “devices” dataset. However, first we need to understand a little more about merge types and the sizes of the output dataframe.
Inner, Left, and right merge types
In our example above, we merged user_usage with user_devices. The head() preview of the result looks great, but there’s more to this than meets the eye. First, let’s look at the sizes or shapes of our inputs and outputs to the merge command:
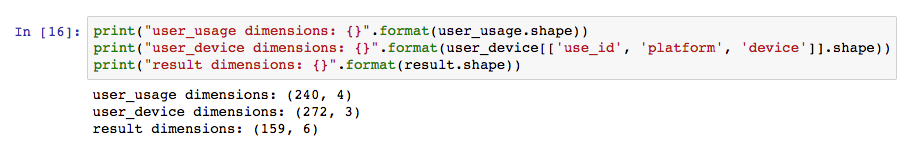
Why is the result a different size to both the original dataframes?
By default, the Pandas merge operation acts with an “inner” merge. An inner merge, (or inner join) keeps only the common values in both the left and right dataframes for the result. In our example above, only the rows that contain use_id values that are common between user_usage and user_device remain in the result dataset. We can validate this by looking at how many values are common:
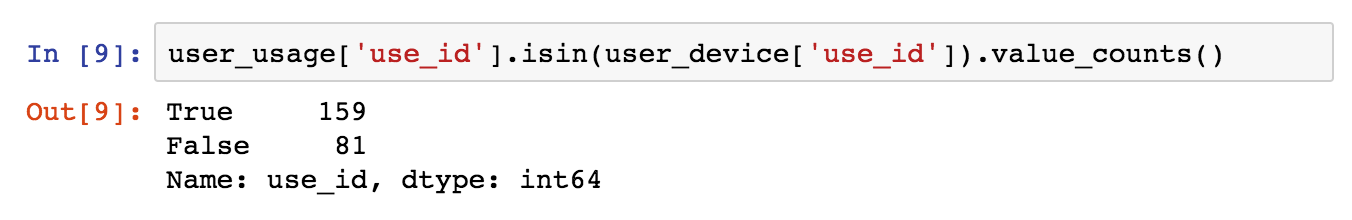
There are 159 values of use_id in the user_usage table that appear in user_device. These are the same values that also appear in the final result dataframe (159 rows).
Other Merge Types
There are three different types of merges available in Pandas. These merge types are common across most database and data-orientated languages (SQL, R, SAS) and are typically referred to as “joins”. If you don’t know them, learn them now.
- Inner Merge / Inner join – The default Pandas behaviour, only keep rows where the merge “on” value exists in both the left and right dataframes.
- Left Merge / Left outer join – (aka left merge or left join) Keep every row in the left dataframe. Where there are missing values of the “on” variable in the right dataframe, add empty / NaN values in the result.
- Right Merge / Right outer join – (aka right merge or right join) Keep every row in the right dataframe. Where there are missing values of the “on” variable in the left column, add empty / NaN values in the result.
- Outer Merge / Full outer join – A full outer join returns all the rows from the left dataframe, all the rows from the right dataframe, and matches up rows where possible, with NaNs elsewhere.
The merge type to use is specified using the “how” parameter in the merge command, taking values “left”, “right”, “inner” (default), or “outer”.
Venn diagrams are commonly used to exemplify the different merge and join types. See this example from Stack overflow:
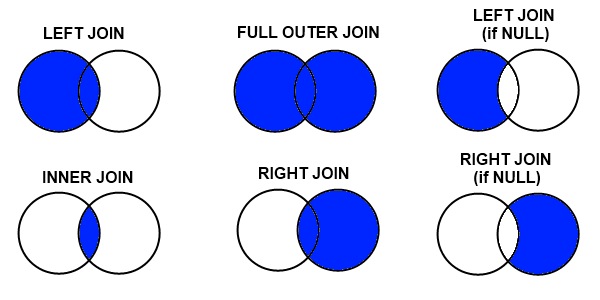
If this is new to you, or you are looking at the above with a frown, take the time to watch this video on “merging dataframes” from Coursera for another explanation that might help. We’ll now look at each merge type in more detail, and work through examples of each.
Example of left merge / left join
Let’s repeat our merge operation, but this time perform a “left merge” in Pandas.
- Originally, the result dataframe had 159 rows, because there were 159 values of “use_id” common between our left and right dataframes and an “inner” merge was used by default.
- For our left merge, we expect the result to have the same number of rows as our left dataframe “user_usage” (240), with missing values for all but 159 of the merged “platform” and “device” columns (81 rows).
- We expect the result to have the same number of rows as the left dataframe because each use_id in user_usage appears only once in user_device. A one-to-one mapping is not always the case. In merge operations where a single row in the left dataframe is matched by multiple rows in the right dataframe, multiple result rows will be generated. i.e. if a use_id value in user_usage appears twice in the user_device dataframe, there will be two rows for that use_id in the join result.
You can change the merge to a left-merge with the “how” parameter to your merge command. The top of the result dataframe contains the successfully matched items, and at the bottom contains the rows in user_usage that didn’t have a corresponding use_id in user_device.
result = pd.merge(user_usage,
                 user_device[['use_id', 'platform', 'device']],
                 on='use_id',
                 how='left')

Example of right merge / right join
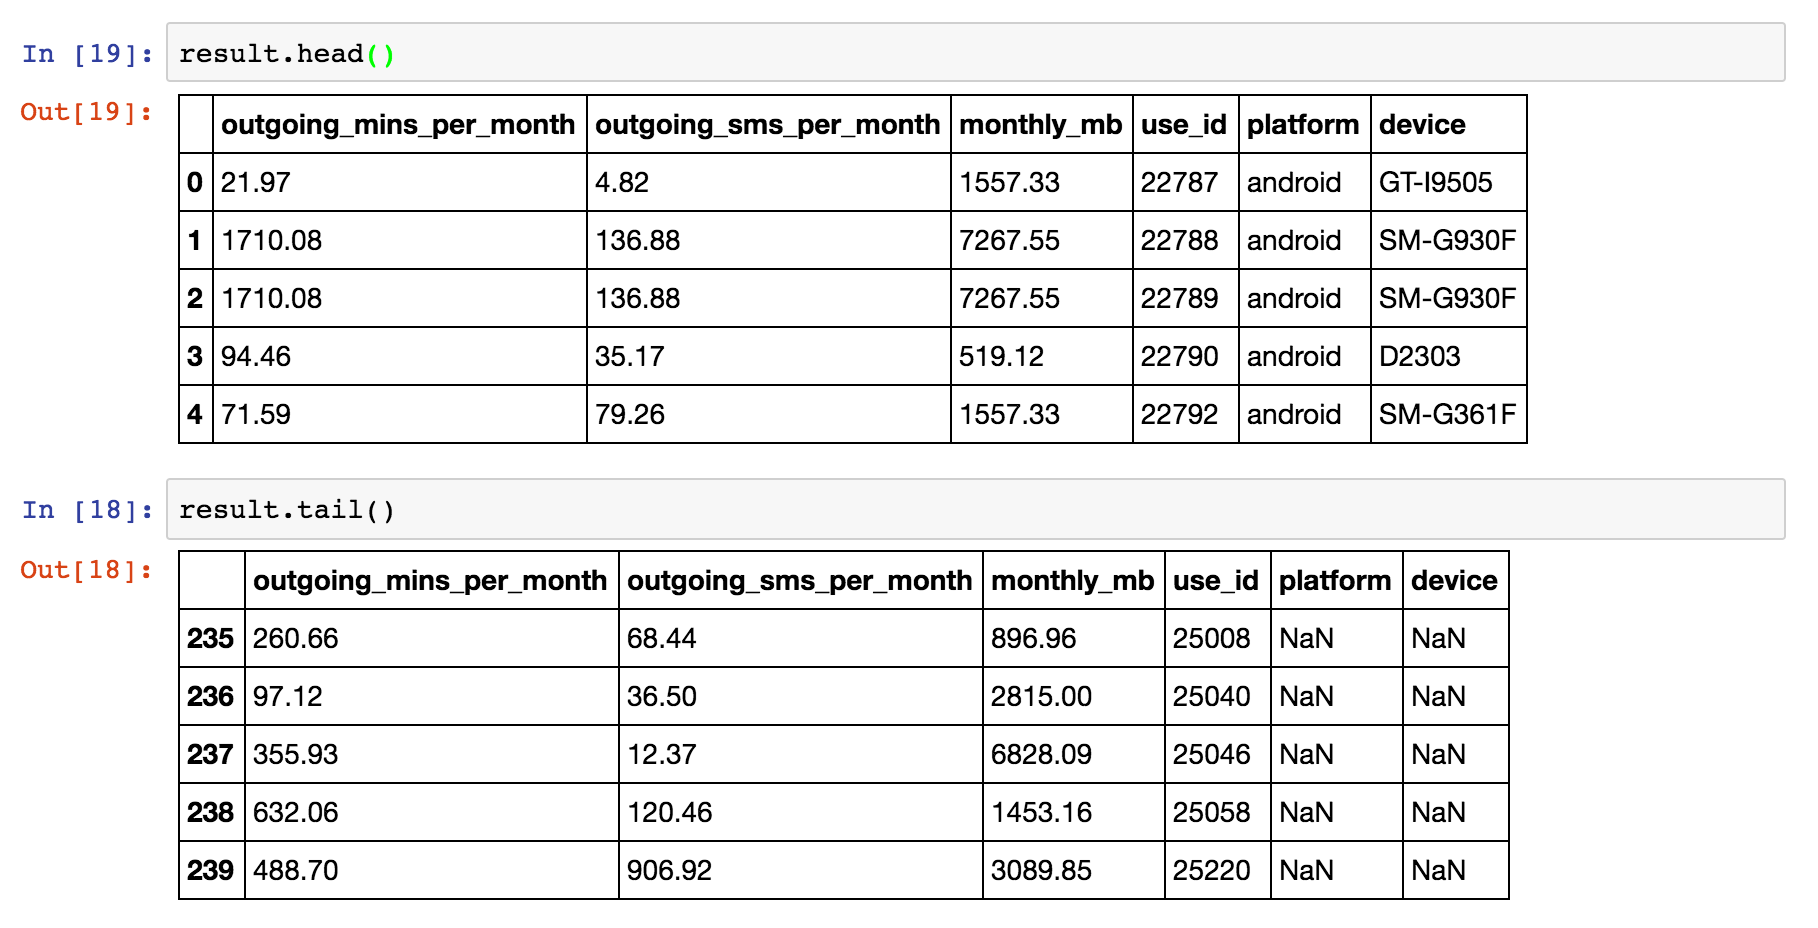
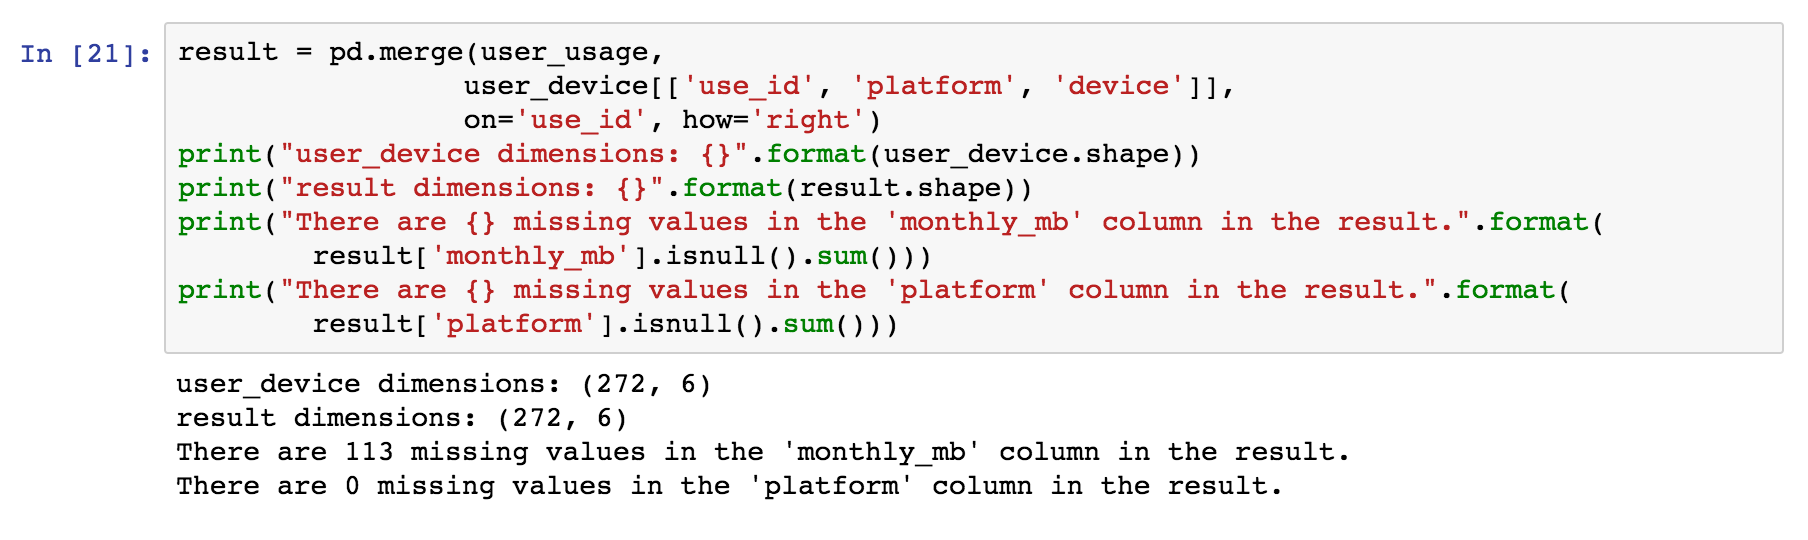
For examples sake, we can repeat this process with a right join / right merge, simply by replacing how=’left’ with how=’right’ in the Pandas merge command.
result = pd.merge(user_usage,
                 user_device[['use_id', 'platform', 'device']],
                 on='use_id',
                 how='right')
The result expected will have the same number of rows as the right dataframe, user_device, but have several empty, or NaN values in the columns originating in the left dataframe, user_usage (namely “outgoing_mins_per_month”, “outgoing_sms_per_month”, and “monthly_mb”). Conversely, we expect no missing values in the columns originating in the right dataframe, “user_device”.
Example of outer merge / full outer join
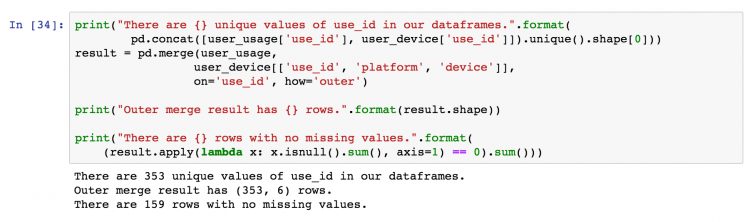
Finally, we will perform an outer merge using Pandas, also referred to as a “full outer join” or just “outer join”. An outer join can be seen as a combination of left and right joins, or the opposite of an inner join. In outer joins, every row from the left and right dataframes is retained in the result, with NaNs where there are no matched join variables.
As such, we would expect the results to have the same number of rows as there are distinct values of “use_id” between user_device and user_usage, i.e. every join value from the left dataframe will be in the result along with every value from the right dataframe, and they’ll be linked where possible.
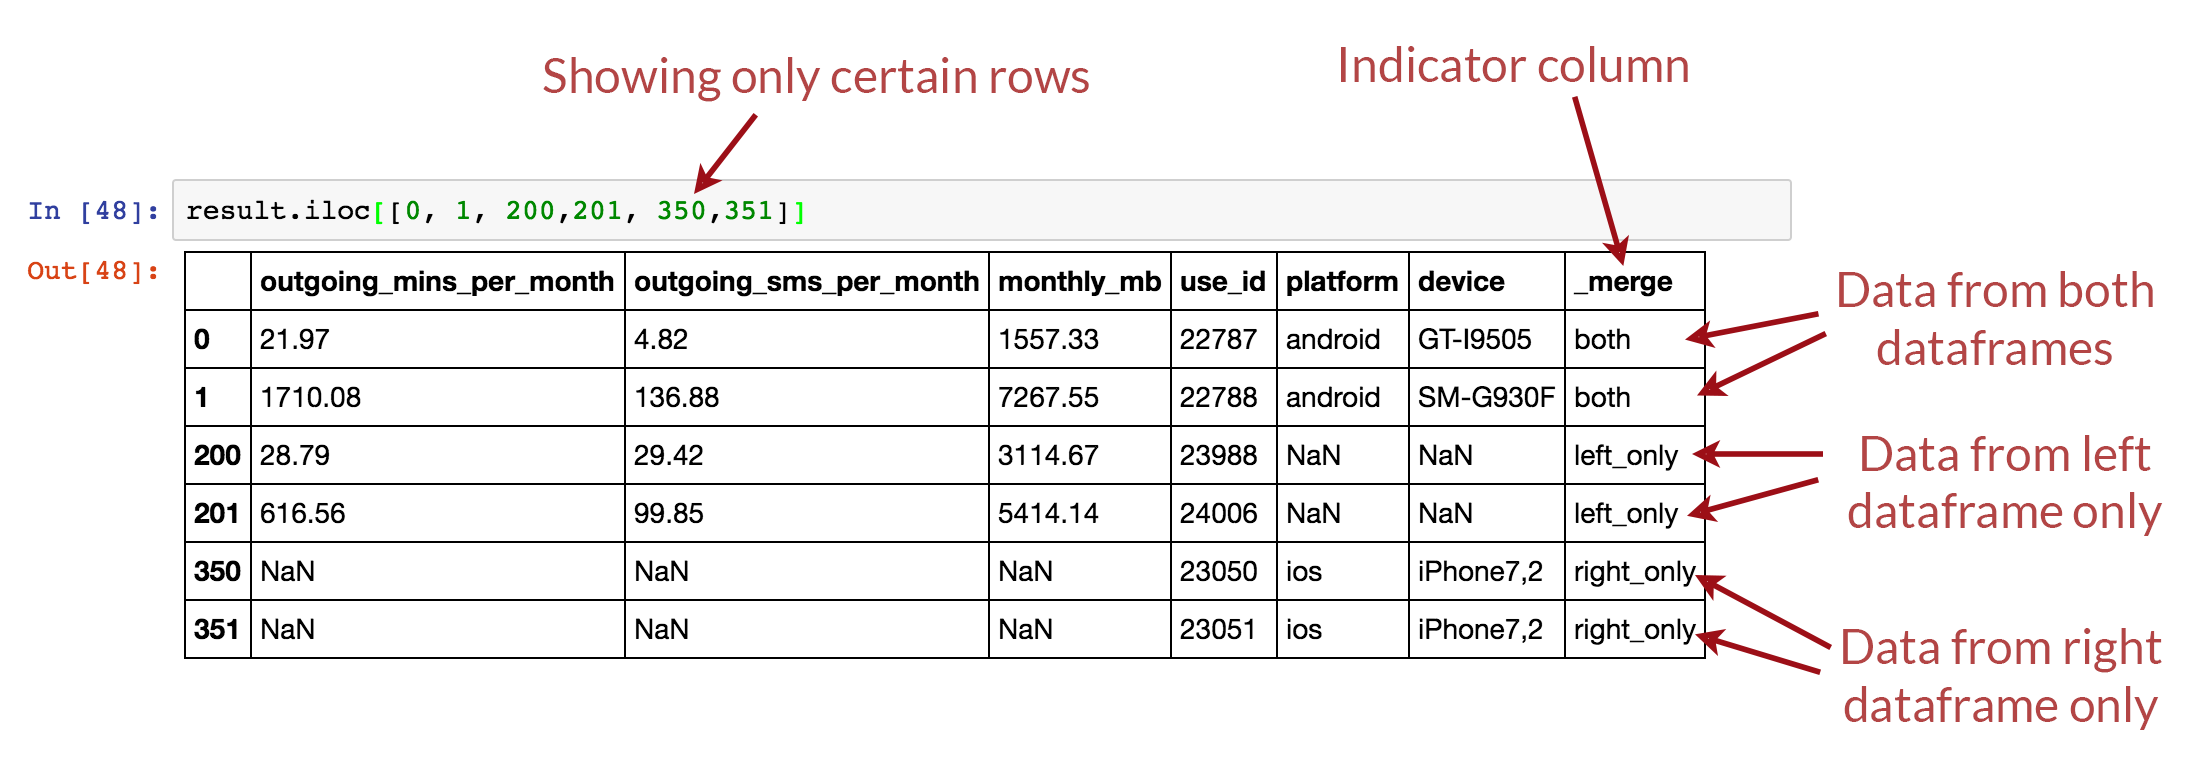
In the diagram below, example rows from the outer merge result are shown, the first two are examples where the “use_id” was common between the dataframes, the second two originated only from the left dataframe, and the final two originated only from the right dataframe.
Using merge indicator to track merges
To assist with the identification of where rows originate from, Pandas provides an “indicator” parameter that can be used with the merge function which creates an additional column called “_merge” in the output that labels the original source for each row.
result = pd.merge(user_usage,
                 user_device[['use_id', 'platform', 'device']],
                 on='use_id',
                 how='outer',
                 indicator=True)
Final Merge – Joining device details to result
Coming back to our original problem, we have already merged user_usage with user_device, so we have the platform and device for each user. Originally, we used an “inner merge” as the default in Pandas, and as such, we only have entries for users where there is also device information. We’ll redo this merge using a left join to keep all users, and then use a second left merge to finally to get the device manufacturers in the same dataframe.
# First, add the platform and device to the user usage - use a left join this time.
result = pd.merge(user_usage,
user_device[['use_id', 'platform', 'device']],
on='use_id',
how='left')
# At this point, the platform and device columns are included
# in the result along with all columns from user_usage
# Now, based on the "device" column in result, match the "Model" column in devices.
devices.rename(columns={"Retail Branding": "manufacturer"}, inplace=True)
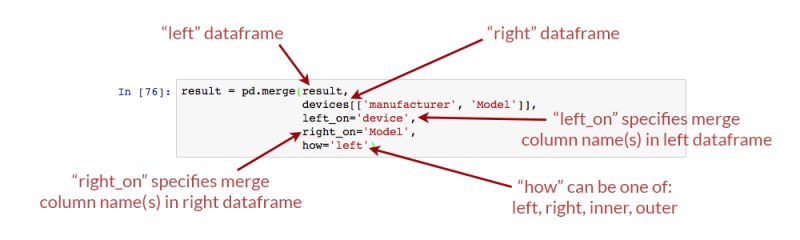
result = pd.merge(result,
devices[['manufacturer', 'Model']],
left_on='device',
right_on='Model',
how='left')
print(result.head())
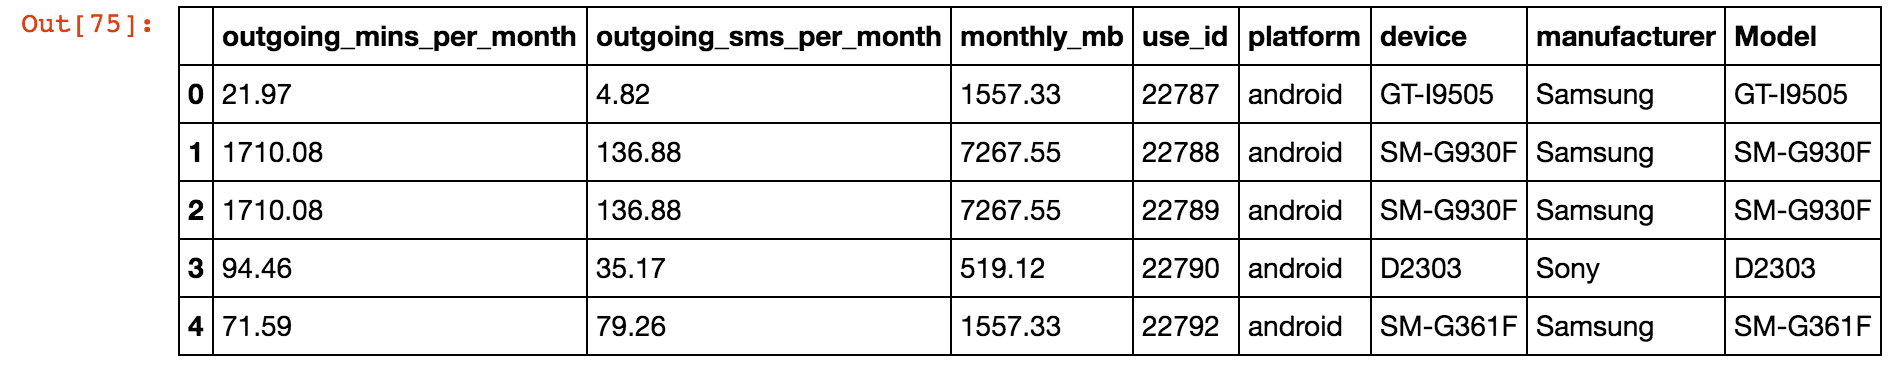
Using left_on and right_on to merge with different column names
The columns used in a merge operator do not need to be named the same in both the left and right dataframe. In the second merge above, note that the device ID is called “device” in the left dataframe, and called “Model” in the right dataframe.
Different column names are specified for merges in Pandas using the “left_on” and “right_on” parameters, instead of using only the “on” parameter.
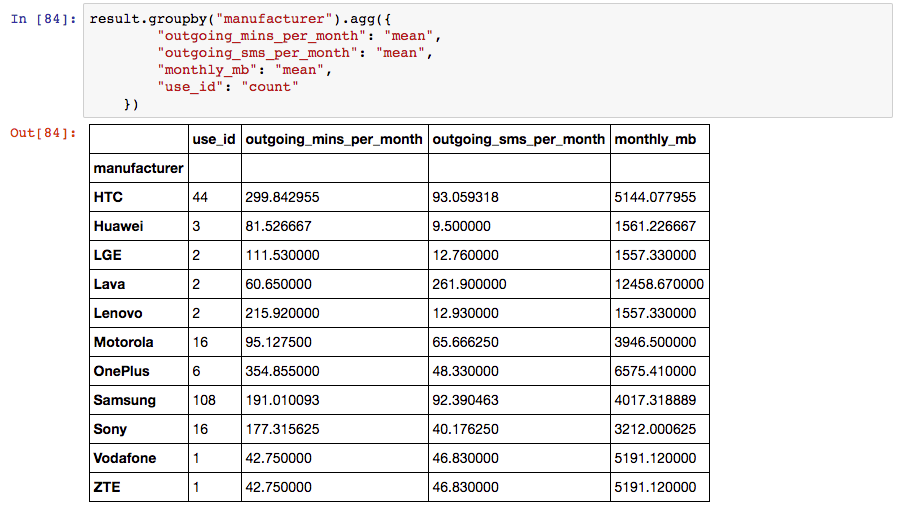
Calculating statistics based on device
With our merges complete, we can use the data aggregation functionality of Pandas to quickly work out the mean usage for users based on device manufacturer. Note that the small sample size creates even smaller groups, so I wouldn’t attribute any statistical significance to these particular results!
result.groupby("manufacturer").agg({
        "outgoing_mins_per_month": "mean",
        "outgoing_sms_per_month": "mean",
        "monthly_mb": "mean",
        "use_id": "count"
    })
Becoming a master of merging – Part 2
That completes the first part of this merging tutorial. You should now have conquered the basics of merging, and be able to tackle your own merging and joining problems with the information above. Part 2 of this blog post addresses the following more advanced topics:
- How do you merge dataframes using multiple join /common columns?
- How do you merge dataframes based on the index of the dataframe?
- What is the difference between the merge and join fucntions in Pandas?
- How fast are merges in Python Pandas?
Other useful resources
Don’t let your merging mastery stop here. Try the following links for further explanations and information on the topic:
- Join and Merge Dataframes examples by Chris Albon.
- Merge, join, and concatenate official reference documentation from Pandas.
- Combining DataFrames with Pandas on “Python for Ecologists” by DataCarpentry
- YouTube tutorial on Joining and Merging Dataframes by “sentdex”
- High performance database joins with Pandas, a comparison of merge speeds by Wes McKinney, creator of Pandas.
- SQL Join tutorial on W3Schools
- SQL Join tutorial on DoFactory
- Comparing pandas merge with SQL in official Pandas documentation.
Thank you for this tutorial ! Really useful and practical.
Where is the second part of this tutorial ? You talk about a second part but i didn’t find .. maybe it’s me.
Hi Mohamed, I’m glad you liked it. Unfortunately the second part is a “work in progress!” and time is short at the moment. Though hopefully I’ll upload it in the coming weeks!
Hi, Wow!, What an indepth tutorial on Pandas Merge(), and way best, than offical Pandas documentation, and any other online resources. #ManyThanks for writing it, and looking foward for Part 2 of it. #ThanksOnceAgain
[…] Master Merges and Joins with Pandas […]
Great material, thank you!! I’m waiting for the second part.
Right now I’m struggling with the merge of two complementary data frames, each of them have the same columns names and number, but one has NaN values where the other one as NON-NaN. Do you have any idea of how to merge them keeping only the NON-NaN values?
Like I emailed you, you should have a place for those of us who feel like making a donation to your efforts. This tutorial is beautifully simple to understand and I want to encourage you and others like you to keep up the good work. I also am waiting for part 2.
Great help, thank you very much Shane! how can we find the second part of the tutorial?
Hi Saraa – I’m afraid the second part of the tutorial is delayed due to my time constraints! Its on a todo list – Might be short and sweet when I can get it done!
Wow, amazing tutorial !
Thanks for putting this together, really helps.
Excellent tutorial. I like your tutorials a lot Shane. Thanks very much!
Thanks for sharing
Hi Shane,
Thanks for your excellent tutorial; that is really helpful!
One thing I am not yet understanding well. In your last merge, you are joining the ‘extended usage’ dataset (merge of user_usage and user_device) with the android devices dataset. You do so by joining the device variable from the usage on the Model variable in devices.
But this Model variable seems to be non-unique in the android dataset. E.g., Model 201M refers to two different devices, scorpion_mini_t and smq_t.
Wouldn’t this possibly result in a duplication of a usage record (if this 201M device occurs in one usage record)? And, consequently, in an error in the calculation later on?
Thanks for helping me out!
Hi Shane. Would it be possible to come back to my question, here above? ~Roy
Hi Roy – no problem, sorry I missed that. Looking now at the merge, yes, if the model variable is non-unique, then yes, you will end up with a duplicate row for each device that matches those model strings. At the time of writing, I assumed that these models were unique! Good spot!
Best to remove those duplicates from the dataset prior to merging!
Thanks for sharing i’ve been dealing with joins until i found your blog. 😀
That’s great Rafael – super that you found it useful!
Very clear tutorial. Thanks!
Shane, could be please help me with the Second part. I ma not able to find it.
Hi Abhishek, I’m afraid, the second part is not done yet – its’ been on my todo list for FAR too long now – hopefully in the next while!
Excellent tutorial. I couldn’t find a easy interpretation of left_on and right_on in major websites. I unblocked ads in this website. Win win for both of us. Enjoy ur coffee. 😀 Thank god i landed here. thanks.
Really good stuff! Can’t wait for Part 2 (but understand you’re busy)
Thanks a lot for this much needed tutorial. Looking forward for part 2.
thanks Shane for explained these topics in well mannered .. its really very helpful to us. could you please help more with part 2.
Very helpful!! I’m not finding the link to the second tutorial, where can I find this?
So, 2 years have past. Is there a part2? This one is phenomenal!
Great feedback Kippi – I’m glad you liked the tutorial! I’ve been putting this on the long finger for quite some time now, perhaps later this year I will get part 2 sorted!
Hello. I have very frequently a data quality issue that surfaces when executing and outer join of 2 dataframes and I would like to have a function that points me to the problematic rows.
For example.
I have a dataframe “all_countries” with country_names of the world and its population.
I have another dataframe ‘my_first_visit” with countries I visited and the date of my first visit. Since I have not visit every country this data frame has far less rows.
With an outer join both dataframes by county_name I expect a data frame with the length of “all_countries”, and for the ones I visited with additional information of the date of my first visit.
However, very often I get a dataframe that has MORE ROWS than the data frame “all_countries”.
Why? Because some of the country names of the dataframe ‘my_first_visit” are miss-spell and they are not properly matched on the join.
It would be very if there was a function (or if I could create one) that accepting 3 parameters would return the non matched rows of the second dataframe Something like:
ProblemRows(all_countries,,my_first_visit, country_name)
Is there something off-the-shelf? Any tips?
Thank you very much in advance.
Very nice explanation. Thanks Shane
Come on, give us Part 2!
Great tutorial!
thank you – really helped in my studies
link update https://datacarpentry.org/python-ecology-lesson/05-merging-data/
Thanks this is great
Really clear. Bravo, shanelynn! You helped me with a project.
Thank you for pointing out how to merge on two differently named columns … saved my day
Thank you for this clear explanation. Pandas documentation is so abbreviated it does almost nothing to help you understand how and especially when to use these options.
[…] This link explains well the different types of merge possible. […]
It was a big help to a learner who was confused by just reading the documents.
Thanks.